Did It Work!? A Brief Look at Professional Development Evaluation in Higher Education & Beyond

As I continue to dive deeper into the research related to professional development (PD) and adult learning initiatives within higher education, one aspect of PD I’ve yet to explore is the evaluation of PD.  In other words, how do we determine if a PD enterprise was successful?  Is the learning having an ongoing, meaningful impact in the workplace?  Did it make a difference? 

Image Courtesy of stock.adobe.com

In order to answer these questions, we must step back to think about two things: 1) what do we mean by ‘success’ in relation to PD (in other words, what particular indicators should we pay attention to), and 2) how/when should we gather data related to those indicators? 

As an entry point to this investigation, Guskey (2002) does an excellent job of pointing our attention to key indicators of effective PD and adult learning, as well as possible ways of gathering data related to those indicators.  These indicators (or “levels of evaluation”) are applicable for higher education instructors just as much as they are for K-12 teachers. Accordingly, Five Possible Indicators of PD Effectiveness—as I am referring to them—are summarized below: 

Indicator What’s measured? How will data be gathered? 
Participants’ Reactions Did participants enjoy the learning experience? Did they trust the expertise of those teaching/leading? Is the learning target perceived as relevant/useful? Was the delivery format appropriate/comfortable? Exit Questionnaire, informal narrative feedback from attendees 
Participants’ Learning Did participants acquire new knowledge/skills? Did the learning experience meet objectives? Was the learning relevant to current needs? Participant reflections, portfolios constructed during the learning experience, demonstrations, simulations, etc. 
Organization Support/Change Was the support for the learning public and overt? Were the necessary resources for implementation provided? Were successes recognized/shared? Was the larger organization impacted? Structured interviews with participants, follow-up meetings or check-ins related to the PD, administrative records, increased access to needed resources for implementation 
Participants’ Use of New Knowledge/Skills Did participants effectively apply the new knowledge/skills? Is the impact ongoing? Were participants’ beliefs changed as a result of the PD? Surveys, instructor reflections, classroom observations, professional portfolios 
Student Learning Outcomes What was the impact on student academic performance? Are students more confident and/or independent as learners? Did it influence students’ well-being? Either qualitative (e.g. student interviews, teacher observations) or quantitative (e.g. assignments/assessments) improvements in student output/performance, behaviors, or attitudes 
Table adapted from Figure 1.1,”Five Levels of Professional Development Evaluation” in Guskey (2002) 

It is important to note that these indicators often work on different timelines and will be utilized at different stages in PD evaluation, but they should also be considered in concert with one another as much as possible (Guskey, 2002).  For example, data about participants’ reactions to PD can be collected immediately and is an easy first step towards evaluating the effectiveness of PD, but participants’ initial reactions as reflected in an exit survey, for example, certainly won’t paint the whole picture.  Student learning outcomes are another indicator to consider, but this indicator will not be able to be measured right away and will require time and follow-up well beyond the initial PD activity or workshop. Furthermore, it can be harmful to place too much evaluative emphasis on any single indicator. If student learning outcomes are the primary measure taken into consideration, this puts unfair pressure on the “performance” aspect of learning (e.g. assessments) and ignores other vital evidence such as changed attitudes or beliefs on the part of the teacher or the role of context and applicability in the learning: 

“…local action research projects, led by practitioners in collaboration with community members and framed around issues of authentic social concern, are emerging as a useful framework for supporting authentic professional learning.”

(Webster-Wright, 2009, p.727)

In most instances, PD evaluation may consist entirely of exit surveys or participant reflections shortly after they complete a workshop or learning activity, and very little follow-up (e.g. classroom observations, release time for collaboration using learned skills) occurs into the future (Lawless & Pellegrino, 2007).  This does nothing to ensure that professional learning is truly being integrated in a way that has meaningful, ongoing impact.  In fact, in their 2011 study dedicated to evaluating faculty professional development programs in higher education, Ebert-May et al. (2011) found that 89% of faculty who participated in a student-centered learning workshop self-reported making changes to their lecture-based teaching practices.  When considered by itself, this feedback might lead some to conclude that the PD initiative was, in fact, effective.  However, when these same instructors were observed in action in the months (and years!) following their professional learning workshop, 75% of faculty attendees had in fact made no perceptible changes to their teacher-centered, lecture-based teaching approach, demonstrating “…a clear disconnect between faculty’s perceptions of their teaching and their actual practices” (Ebert-May et al., 2011).  Participants’ initial reactions and self-evaluations can’t be considered in isolation.  Organizational support, evidence of changed practice, and impact on student learning (both from an academic and ‘well-being’ perspective) must be considered as well.  Consequently, we might reasonably conclude that one-off PD workshops with little to no follow-up beyond initial training will hardly ever be “effective.” 

It is also worth mentioning here that the need for PD specifically in relation to technology integration has been on the rise over the last two decades, and this need has accelerated even more during the pandemic.  In recent years the federal government has invested in a number of initiatives meant to ensure that schools—especially K-12 institutions—keep pace with technology developments (Lawless & Pellegrino, 2007). These initiatives include training the next generation of teachers to use technology in their classrooms and retraining the current teacher workforce in the use of tech-based instructional tactics (Lawless & Pellegrino, 2007). With technology integration so often in the forefront of PD initiatives, it begs the question: should tech-centered PD be evaluated differently than other PD enterprises? 

I would argue no. In a comprehensive and systematic literature review of how technology use in education has been evaluated in the 21st century, Lai & Bower (2019) found that the evaluation of learning technology use tends to focus on eight themes or criteria:  

  1. Learning outcomes: academic performance, cognitive load, skill development 
  1. Affective Elements: motivation, enjoyment, attitudes, beliefs, self-efficacy 
  1. Behaviors: participation, interaction, collaboration, self-reflection 
  1. Design: course quality, course structure, course content 
  1. Technology Elements: accessibility, usefulness, ease of adoption 
  1. Pedagogy: teaching quality/credibility, feedback 
  1. Presence: social presence, community 
  1. Institutional Environment: policy, organizational support, resource provision, learning environment 

It seems to me that these eight foci could all easily find their way into the adapted table of indicators I’ve provided above. Perhaps the only nuance to this list is an “extra” focus on the functionality, accessibility, and usefulness of technology tools as they apply to both the learning process and learning objectives. Otherwise, it seems to me that Lai & Bower’s (2019) evaluative themes align quite well with the five indicators of PD effectiveness adapted from Guskey (2002), such that the five indicators might be used to frame PD evaluation in all kinds of settings, including the tech-heavy professional learning occurring in the wake of COVID-19. 

References: 

Ebert-May, D., Derting, T. L., Hodder, J., Momsen, J. L., Long, T. M., & Jardeleza, S. E. (2011). What we say is not what we do: Effective evaluation of faculty professional development programs. BioScience, 61(7), 550-558. https://academic.oup.com/bioscience/article/61/7/550/266257?login=true 

Guskey, T. R. (2002). Does it make a difference? Evaluating professional development. Educational leadership, 59(6), 45. https://uknowledge.uky.edu/cgi/viewcontent.cgi?article=1005&context=edp_facpub 

Lai, J.W.M. & Bower, M. (2019). How is the use of technology in education evaluated? A systematic review. Computers in Education 133, 27-42. https://doi.org/10.1016/j.compedu.2019.01.010 

Lawless, K. A., & Pellegrino, J. W. (2007). Professional development in integrating technology into teaching and learning: Knowns, unknowns, and ways to pursue better questions and answers.  Review of Educational Research, 77(4), 575-614.https://journals.sagepub.com/doi/full/10.3102/0034654307309921 

Webster-Wright, A. (2009). Reframing professional development through understanding authentic professional learning. Review of Educational Research, 79(2), 702-739.https://journals.sagepub.com/doi/full/10.3102/0034654308330970 

Learning Analytics in Higher Education: What’s Working?

Image Source: https://www.openpr.com/

Data analytics play their part in all aspects of work and industry these days, and there’s no question that data analytics are also here to stay in the world of higher education. Through tracking, aggregating, and analyzing student activity captured in learning management systems, universities are hoping to “open the black box of education” using learning analytics technologies (Jones, 2019). Of course, in order to analyze data, there must be data to look at in the first place, and as the number of students participating in online learning has increased exponentially (both in K-12 and higher education) during the COVID-19 Pandemic, the amount of educational data instructors and administrators readily have access to has increased as well.  In fact, perhaps unsurprisingly, according to Wong 2021 and a 2020 survey conducted by EDUCAUSE, demand for student success analytics, particularly in relation to online teaching/learning activity, increased by 66 percent during the pandemic. 

Yet the use of data in any capacity brings with it a whole host of questions: where is the data coming from and is it ethically sourced? For what purpose is the data being used?  Is the data capturing the ‘big picture’ or is it only one piece of the puzzle?  Are there biases in the data that need to be reckoned with?  Data, in all its forms, is hardly neutral, and thus we must proceed carefully as we look to data to influence decision-making in education.  In my mind, data will only ever tell part of the story, but it certainly can be a helpful tool in the educator toolbox when handled with care and context. 

Perhaps it is also helpful to clarify what I’m referring to when I say ‘student data.’  For the purposes of this post, I’m referring to certain biographical and socio-economic information related to a student’s background (e.g. whether or not a student is first-generation, financial aid information, etc.), student behavior and participation in courses and campus life, and student performance in particular courses in the form of grades.  When it comes to analyzing this data and using that analysis to improve teaching and learning, what’s working in postsecondary education? 

Identifying At-Risk Students at the Institutional Level: 

An oft-cited use for student data in higher education in this moment is identifying students who might be at-risk of dropping out in order to offer early intervention and support.  This is often done at the administrative/academic services level as opposed to the level of individual course instructors.   

Since 2017, Gannon University, a private Catholic University in Pennsylvania, has been using a “homegrown application” which collects and aggregates data points from applications across campus, including data related to a student’s academic performance, financial well-being, and engagement in campus activities/community (Wong, 2021). In other words, both qualitative and quantitative data points are observed.  A computer model helps determine which data points are most significant, and then summarizes the important data for a student dashboard format. Staff and administrators then check the data dashboard four or five times each semester, including at key grading periods, and if students are flagged as struggling, the advising center or the student development and engagement offices reach out to check on them (Wong, 2021). 

Using a similar three-pronged approach, staff and administrators at the University of Kentucky use Tableau software to help interpret student data and identify students who may need support with academics, financial stability, or health and social well-being (Wong, 2021).  Based on the data and the populations of students who are flagged as at-risk, staff and faculty have formed outreach protocol, including the ability to increase financial aid support for specific students through grant funding when needed.   

Both Gannon and the University of Kentucky have seen retention rates increase over 4% as a result of their meaningful use of student data (Wong, 2021).  Of particular note here is the use of data from multiple sources, all of which help tell a fuller story of student success.  Grades aren’t the only indicator of a student’s level of risk; financial stability and social well-being are treated as equally important information sources. 

Improving Classroom Instruction: 

Student data can also be helpful to individual instructors as they look to monitor the effectiveness of their instruction and better meet the needs of students who may be struggling.  In an earlier post titled Using Canvas Analytics to Support Student Success, I specifically looked at the student data analytics capabilities native to the Canvas LMS platform, but there are certainly plenty of comparable features in other LMS platforms which would assist instructors in the efficient analysis of student data. 

When it comes to student engagement and indicators of successful course completion, information gathered in the first weeks of the course can prove invaluable.  Rather than being used solely for instructor reflection or summative ‘takeaway’ information about the effectiveness of the course design, course analytics may be used as early predictors of student success, and the information gleaned may be used to initiate interventions from instructors or academic support staff (Wagner, 2020).  For example, if a student in an online course is having internet access issues, the instructor can likely see this reflected early-on in the student’s LMS analytics data (not logging in to the course, not accessing important posted materials, etc.). The instructor would have reason to reach out and make sure the student has what they need in order to engage with the course content.  If unstable internet access is the issue, the instructor may then flex due dates, provide extra downloadable materials, or continually modify assignments as needed throughout the quarter in order to better support the student. 

In addition to student performance, LMS analytics tools may be used by the instructor to think about the efficacy of their course design, especially in online learning environments.  Course analytics tools can help instructors see which resources are being viewed/downloaded, which discussion boards are most active (or inactive), what components of the course are most frequented, etc.  Technology can also help instructors save valuable time.  For example, course analytics tools can quickly cull through quiz results to identify which concepts remain hazy in students’ minds, helping instructors to efficiently discern which of their lesson plans is most effective, and which concepts need more attention and/or a different teaching approach (O’Bryan & Shah, 2021).   

Gathering Student Feedback: 

Finally, student surveys have proven to be another effective way to access student data and meaningfully use that data in support of student success.  Student surveys elevate the use of student voice within the data, and they are much easier to use where data privacy management is concerned. “Since learning analytics often rely on aggregating significant amounts of sensitive and personal student data from a complex network of information flows, it raises an important question as to whether or not students have a right to limit data analysis practices and express their privacy preferences as means to controlling their personal data and information” (Jones, 2019).  Within a survey context, students have choice around when and how they participate in providing data, and they often have greater insight into how the data will be used afterward.  This is not always the case when it comes to data used in and through learning management systems, and many scholars and researchers feel that the ethics behind data collection/use/privacy in learning analytics have yet to be properly addressed (Viberg et al., 2018; Jones, 2019). 

To that end, University of Connecticut offers a great example of elevating student “voice and choice” in the data collection process.  UC has developed a software suite in-house called Nexus that is designed to involve the entire campus community in improving student retention and success, especially the students themselves. Students can choose to log in to a UC campus application at any time to create study groups with classmates, schedule advising and tutoring appointments, and connect with mentors and other resources as needed. The university also occasionally asks students to fill out a short online survey when they log in to the app; the 60-second survey asks critical questions such as how they are doing and whether they are contemplating dropping out for any reason (Wong, 2021).  Thus, in this approach, students are able to volunteer data relevant to their learning needs and connect to available resources when it feels appropriate to them; they are not passive in the data collection process. 

Course completion surveys are also commonly used by higher education institutions, and these surveys provide important student-sourced feedback about the effectiveness of individual instructors and courses.  However, since the feedback is summative/reflective in nature, its ability to have any impact on an individual student’s learning at a point of accute struggle during a term of study is limited, if not completely obsolete.  Additionally, these course surveys are usually more focused on growth and improvement for instructors and course design, and the data collected gives little additional insight on individual student performance. 

Summary: 

To be sure, there are likely many other examples of places and spaces where data analytics are working well in higher education, and I’ve only touched on a few key areas in this post, but generally speaking, data or learning analytics seem to be proving helpful at the institutional level to improve retention rates, at the instructor level as a way of efficiently identifying student needs in real time within a course, and at the student level when student feedback data, often via surveys, is used meaningfully in support of student success.  Learning analytics have not been, and will never be, some kind of computer-aided substitute for sound pedagogical assessment in a classroom. Furthermore, as mentioned above, educators are wise to bear in mind that any single data set is only part of a larger story.  Learning analytics seem to be at their best to the extent that they are truly used in support of individual student growth and flourishing in all aspects of education.  As Viberg et al. (2018) would posit, the more the use of learning analytics in higher education shifts focus away from a prediction emphasis and towards a dynamic understanding of students’ real-time learning experiences, the more we’ll be able to see authentic and substantive improvements in student outcomes. 

References: 

Jones, K.M.L., (2019). Learning analytics and higher education: a proposed model for establishing informed consent mechanisms to promote student privacy and autonomy. International Journal of Educational Technology in Higher Education, 16(24). https://doi.org/10.1186/s41239-019-0155-0 

O’Bryan, C. & Shah, B. (2021, September 8). Higher education has a data problem. Inside Higher Edhttps://www.insidehighered.com/views/2021/09/08/using-data-holistic-way-support-student-success-opinion 

Wagner, A. (2020, June 6). LMS data and the relationship between student engagement and student success outcomes.  Airweb.org. https://www.airweb.org/article/2020/06/17/lms-data-and-the-relationship-between-student-engagement-and-student-success-outcomes 

Wong, W. (2021, October 18). Higher education turns to data analytics to bolster student success.  EdTechhttps://www.edtechmagazine.com/higher/article/2021/10/higher-education-turns-data-analytics-bolster-student-success 

Viberg, O., Hatakka, M., Balter, O., & Mavroudi, A. (2018). The current landscape of learning analytics in higher education. Computers in Human Behavior 89, 98-110.  https://doi.org/10.1016/j.chb.2018.07.027 

Using Canvas Analytics to Support Student Success

Though online teaching/learning are hardly new concepts in education, the pandemic has necessitated a massive shift to online learning such that educators worldwide–at all levels–have had to engage with online learning in new, immersive ways.  Online learning can take many forms (synchronous, asynchronous, hybrid, hyflex, etc.), but regardless of the form, educators with access to an LMS have been forced to lean into these platforms and leverage the tools within in significant ways, continually navigating (perhaps for the first time) how to best support students in achieving their learning goals using technology.

Without consistent opportunities for face-to-face communication and informal indicators of student engagement that are typically available in a classroom (e.g. body language, participation in live discussions, question asking) a common challenge faced by educators in online learning environments–especially asynchronous ones–is how to maintain and account for student engagement and persistence in the course.  Studies using Educational Data Mining (EDM) have already demonstrated that student behavior in an online course has a direct correlation to their successful completion of the course (Cerezo et al., 2016). Time and again, these studies have supported the assertion that students who are more frequently engaged with the content and discussions in an online course are more likely to achieve their learning goals and successfully complete the course (Morris et al., 2005).  This relationship is, however, tricky to measure, because time spent online is not necessarily representative of the quality of the online engagement.  Furthermore, different students develop different patterns of interaction within an LMS which can still lead to a successful outcome (Cerezo et al., 2016). Consequently, even as instructors look for insights into student engagement from their LMS, they must avoid putting too much emphasis on the available data, or even a ‘one style fits all’ approach to interpreting it.  Instead, LMS analytics should be considered as one indicator of student performance that contributes to the bigger picture of student learning and achievement.  Taken in context, the data that can be quickly gleaned from an LMS can be immensely helpful in identifying struggling or ‘at-risk’ students and/or those who could benefit from differentiated instruction, as well as possible areas of weakness within the course design that need addressing.

Enter LMS analytics tools and the information available within.  For the purposes of this post, I’ll specifically be looking at the suite of analytics tools provided by the Canvas LMS, including Course Analytics, Course Statistics, and ‘New Analytics.’

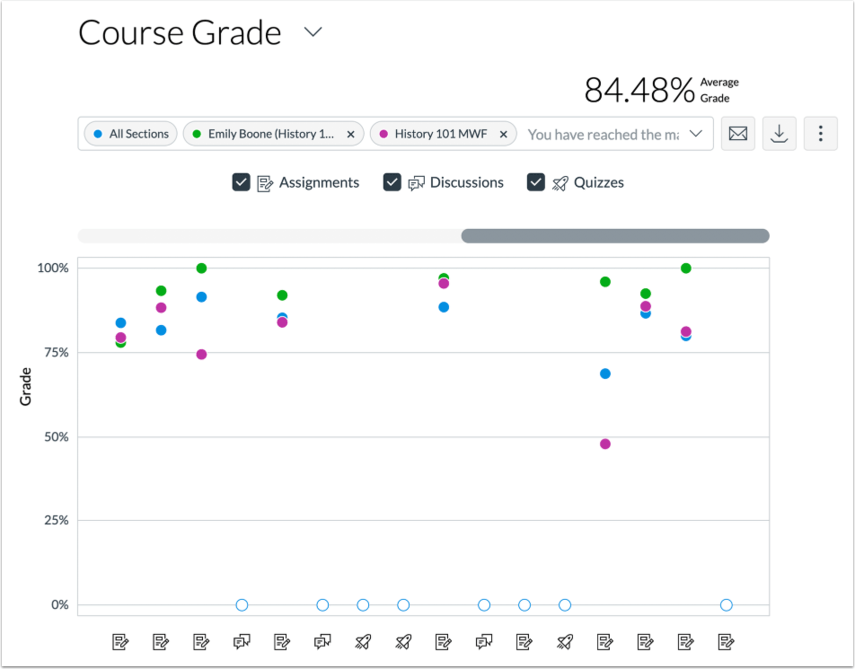
Sample Screenshot of Canvas New Analytics, https://sites.udel.edu/canvas/2019/11/new-canvas-analytics-coming-to-canvas-in-winter-term/
  • Course Analytics are intended to help instructors evaluate individual components of a course as well as student performance in the course.  Course analytics are meant to help identify at-risk students (i.e. those who aren’t interacting with the course material), and determine how the system and individual course components are being used.  The four main components of course analytics are: 
    • Student activity, including logins, page views, and resource usage
    • Submissions, i.e. assignments and discussion board posts
    • Grades, for individual assignments as well as cumulative
    • Student analytics, which is a consolidated page view of the student’s participation, assignments, and overall grade (Canvas Community(a), 2020).  With permission, students may also view their own analytics page containing this information.
  • Course Statistics are essentially a subset of the larger course analytics information pool.  Course statistics offer specific percentages/quantitative data for assignments, discussions, and quizzes.  Statistics are best used to offer quick, at-a-glance feedback regarding which course components are engaging students and what might be improved in the future (Canvas Community(b), 2020).
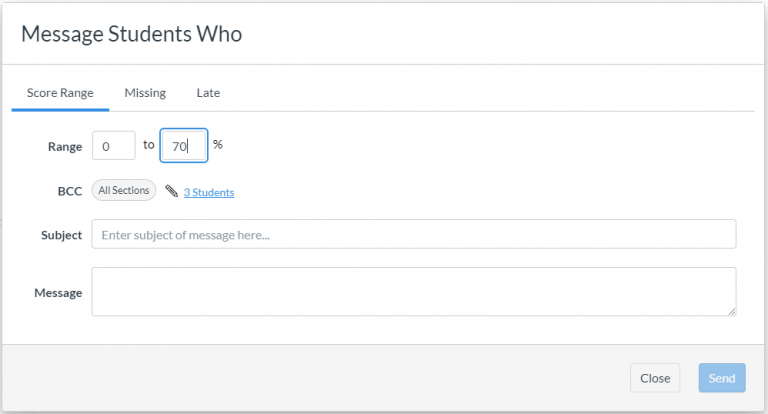
  • New Analytics is essentially meant to be “Course analytics 2.0” and is currently in its initial rollout stage.  Though the overall goal of the analytics tool(s) remains the same, New Analytics offers different kinds of data displays and the opportunity to easily compare individual student statistics with the class aggregate.  The data informing these analytics is refreshed every 24 hours, and instructors may also look at individual student and whole class trends on a week-to-week basis.  In short, it’s my impression that ‘New Analytics’ will do a more effective job of placing student engagement data in context.  Another feature of New Analytics is that instructors may send a message directly to an individual student or the whole class based on a specific course grade or participation criteria (Canvas Community(c), 2020). 
Sample Screenshot of Canvas New Analytics, https://sites.udel.edu/canvas/2019/11/new-canvas-analytics-coming-to-canvas-in-winter-term/

Of course, analytics and statistics are only one tool in the toolbelt when it comes to gauging student achievement, and viewing course statistics need not be the exclusive purview of the instructor.  As mentioned above, with instructor permission, students may view their own course statistics and analytics in order to track their own engagement.  Beyond viewing grades and assignment submissions, this type of feature can be particularly helpful for student reflection on course participation, or perhaps as an integrated part of an improvement plan for a student who is struggling.

Timing should also be a consideration when using an LMS tool like Canvas’ Course Analytics.  When it comes to student engagement and indicators of successful course completion, information gathered in the first weeks of the course can prove invaluable.  Rather than being used solely for instructor reflection or summative ‘takeaway’ information about the effectiveness of the course design, course analytics may be used as early predictors of student success, and the information gleaned may be used to initiate interventions from instructors or academic support staff (Wagner, 2020). Thus, instructors who use Canvas will likely find that their Canvas Analytics tools might actually prove most helpful within the first week or two of the course (University of Denver Office of Teaching & Learning, 2019).  For example, if a student in an online course is having internet access issues, the instructor can likely see this reflected early-on in the student’s LMS analytics data. The instructor would have reason to reach out and make sure the student has what they need in order to engage with the course content.  If unstable internet access is the issue, the instructor may then flex due dates, provide extra downloadable materials, or continually modify assignments as needed throughout the quarter in order to better support the student.

Finally, as mentioned above, in addition to student performance, LMS analytics tools may be used by the instructor to think about the efficacy of their course design.  Canvas’ course analytics tools help instructors see which resources are being viewed/downloaded, which discussion boards are most active (or inactive), what components of the course are most frequented, etc.  Once an online course has been constructed, it can be tempting for instructors to “plug and play” and assume that the course will retain its same effectiveness in every semester it’s used moving forward. Course analytics can help instructors identify redundancies and course elements that are no longer needed/relevant due to lack of student interest.  They can also help instructors think critically about what seems to be working well in their course (i.e. what are students using, where are they spending the most time in the course) why that might be, and how to leverage that for adding other course components or tweaks for the future.

In summary, the information available via an LMS analytics tool should always be considered in concert with all other factors impacting student behavior in online learning, including varying patterns or ‘styles’ in students’ online behaviors and external factors like personal or societal crises that may have impacted the move to online learning in the first place.  Student engagement (as measured by LMS analytics tools) can be helpful tools used for identifying struggling students, providing data for student self-reflection, and providing insight into the effectiveness of the instructors’ course design.  To the extent that analytics tools aren’t considered the “end all be all” when it comes to measuring student success, tools like Canvas Analytics are a worthwhile consideration for instructors teaching online who are invested in student success as well as their own professional development.

References:

Canvas Community(a). (2020). What are Analytics? Canvas. https://community.canvaslms.com/t5/Canvas-Basics-Guide/What-are-Analytics/ta-p/88

Canvas Community(b). (2020). What is New Analytics? Canvas. https://community.canvaslms.com/t5/Canvas-Basics-Guide/What-is-New-Analytics/ta-p/73

Canvas Community(c). (2020). How do I view Course Statistics? Canvas. https://community.canvaslms.com/t5/Instructor-Guide/How-do-I-view-course-statistics/ta-p/1120

Cerezo, R., Sanchez-Santillan, M., Paule-Ruiz, M., & Nunez, J. (2016). Students’ LMS interaction patterns and their relationship with achievement: A case study in higher education. Computers & Education 96, 42-54. https://www.sciencedirect.com/science/article/pii/S0360131516300264

Morris, L.V., Finnegan, C., & Wu, S. (2005). Tracking student behavior, persistence, and achievement in online courses. The Internet and Higher Education 8, 221-231. https://www.sciencedirect.com/science/article/pii/S1096751605000412 

Wagner, A. (2020, June 6). LMS data and the relationship between student engagement and student success outcomes. Airweb.org. https://www.airweb.org/article/2020/06/17/lms-data-and-the-relationship-between-student-engagement-and-student-success-outcomes 

Bias in Higher Ed Admissions: Is New Tech Helping or Hurting?

It’s fairly well known that higher education admissions practices have made headlines in recent years, and issues of access and equity have been at the heart of the controversies. In 2019, a highly-publicized admissions scandal known as Operation Varsity Blues revealed conspiracies committed by more than 30 affluent parents, many in the entertainment industry, offering bribes to influence undergraduate admissions decisions at elite California universities.  The scandal was not limited to misguided actions of wealthy, overzealous parents, however, and it included investigations into the coaches and higher education admissions officials who were complicit (Greenspan, 2019). 

Harvard University has also seen its fair share of scandals including a bribery scheme of its own and controversy over racial bias in the admissions process.  In 2019, a group of Harvard students organizing under the title “Students for Fair Admissions” went to court over several core claims:

  1. That Harvard had intentionally discriminated against Asian-Americans
  2. That Harvard had used race as a predominant factor in admissions decisions
  3. That Harvard had used racial balancing and considered the race of applicants without first exhausting race-neutral alternatives.
Demonstrators hold signs in front of a courthouse in Boston, Massachusetts in October 2018, Xinhua/Barcroft Images

In line with the tenants of affirmative action, the court eventually ruled that Harvard could continue considering race in its admissions process in pursuit of a diverse class, and that race had never (illegally) been used to “punish” an Asian-American student in the review process (Hassan, 2019).  Yet regardless of the ruling, Harvard was forced to look long and hard at its admissions processes and to meaningfully consider where implicit bias might be negatively affecting admissions decisions.

Another area of bias that has been identified in the college admissions system nationwide is the use of standardized tests, especially the SAT or ACT for undergraduate admissions and the GRE or GMAT for graduate admissions.  Changes in demand for these tests have only accelerated during the pandemic with many colleges and universities making SAT/ACT or GRE/GMAT scores optional for admission in 2020-2021 (Koenig, 2020).  Research has oft-revealed how racial bias affects test design, assessment, and performance on these standardized exams, thus bringing biased data into the admissions process to begin with (Choi, 2020). 

That said, admissions portfolios without standardized test scores have one less “objective” data point to consider in the admissions process, putting more weight on other more subjective pieces of an application (essays, recommendations, interviews, etc.). Most university admissions processes in the U.S.—both undergraduate and graduate—are human-centered and involve a “holistic review” of application materials (Alvero et al, 2020).  A study by Alvero et al exploring bias in admissions essay reviews found that applicant demographic characteristics (namely gender and household income) were inferred by reviewers with a high level accuracy, opening the door for biased conclusions drawn from the essay within a holistic review system (Alvero et al, 2020).

So the question remains—how do higher education institutions (HEIs) implement equitable, bias-free, admissions processes that guarantee access to all qualified students and prioritize diverse student bodies?  To assist in this worthwhile quest for equity, many HEIs are turning to algorithms and AI to see what they have to offer. 

Lending a Helping Hand

Without the wide recruiting net and public funding that large State institutions enjoy, the search for equitable recruiting/admissions practices and diverse classes may be hardest for small universities (Mintz, 2020). Taylor University—a small, private liberal arts university in Indiana—has turned to the Salesforce Education Cloud (and the AI and algorithmic tools within) for assistance in many aspects of the admissions and recruiting process.  The Education Cloud and other similar platforms “…use games, web tracking and machine learning systems to capture and process more and more student data, then convert qualitative inputs into quantitative outcomes” (Koenig, 2020). 

As a smaller university with limited resources, the Education Cloud helps Taylor’s admissions officers zero-in on the type of applicants they feel are most likely to enroll, and then identify target populations that exhibit similar data sets in other areas of the country based on that data.  Taylor can then strategically and economically make recruiting efforts where they’re—statistically speaking—likely to get the most interest.  With fall 2015 boasting their largest Freshman class ever, Taylor is, in many ways, a success story, and Taylor now uses Education Cloud data services to predict student success outcomes and make decisions about distributing financial aid and scholarships (Pangburn, 2019).

Understandably, admissions officials want to admit students who have the highest likelihood of “succeeding” (i.e. persisting through to graduation).  Noting that the Salesforce AI predictive tools somehow account for bias that may exist in raw data reporting (like “name coding” or zip code bias), companies with products similar to the Education Cloud market fairer, more objective, more scientific ways to predict student success (Koenig, 2020).  As a result, HEIs like Taylor are confidently using these kinds of tools in the admissions process to help counteract biases that grow “situationally” and often unexpectedly from how admissions officers review applicants, including an inconsistent number of reviewers, reviewer exhaustion, personality preferences, etc. (Pangburn, 2019).   Additionally, AI assists with more consistent and comprehensive “background” checks for student data reported on an application (e.g. confirming whether or not a student was really an athlete) (Pangburn, 2019). Findings from the Alvero et al (2020) study mentioned earlier suggested that AI use and data auditing might be useful in informing the review process by checking potential bias in human or computational readings.

Another interesting proposal for the use of tech in the admissions process is the gamification of data points.  Companies like KnackApp are marketing recruitment tools that would have applicants play a game for 10 minutes.  Behind the scenes, algorithms allegedly gather information about users’ “microbehaviors,” such as the types of mistakes they make, whether those mistakes are repeated, the extent to which the player takes experimental paths, how the player is processing information, and the player’s overall potential for learning (Koenig, 2020). The CEO of KnackApp, Guy Halftek, claims that colleges outside the U.S. already use KnackApp in student advising, and the hope is that U.S. colleges will begin using the platform in the admissions process to create gamified assessments that would provide additional data points and measurements for desirable traits that might not otherwise be found in standardized test scores, GPA, or an entrance essay (Koenig, 2020).

Sample screenshot of a KnackApp game, apkpure.com

Regardless of its specific function in the overall process, AI and algorithms are being pitched as a way to make the admissions system more equitable by identifying authentic data points and helping schools reduce unseen human biases that can impact admissions decisions while simultaneously making bias pitfalls more explicit.

What’s The Catch?

Without denying the ways in which technology has offered significant assistance to—and perhaps progress in—the world of HEI admissions, it’s wise to think critically about the function of AI and algorithms and whether or not they are in fact assisting in a quest for equity.

To begin with, there is a persistent concern among digital ethicists that AI and algorithms simply mask and extend preexisting prejudice (Koenig, 2020).  It is dangerous to assume that technology is inherently objective or neutral, since technology is still created or designed by a human with implicit (or explicit) bias (Benjamin, 2019).  As Ruha Benjamin states in the 2019 publication Race After Technology: Abolitionist Tools for the New Jim Code, “…coded inequity makes it easier and faster to produce racist outcomes.” (p. 12)

Some areas of concern with using AI and algorithms in college admissions include:

  1. Large software companies like Salesforce seem to avoid admitting that bias could ever be an underlying issue, and instead seem to market that they’ve “solved” the bias issue (Pangburn, 2019).
  2. Predictive concerns: if future decisions are made on past data, a feedback loop of replicated bias might ensue (Pangburn, 2019).
  3. If, based on data, universities strategically market only to desirable candidates, they’ll likely pay more visits and make more marketing efforts to students in affluent areas and those who are likely to yield more tuition revenue (Pangburn, 2019).
  4. When it comes to “data-based” decision-making, it’s easier to get data for white, upper-middle-class suburban kids, and models (for recruiting goals, student success, and graduation outcomes) end up being built on easier data (Koenig, 2020).
  5. Opportunities for profit maximization are often rebranded as bias minimization, regardless of the extent to which that is accurate (Benjamin, 2019)
  6. Data privacy… (Koenig, 2020)

Finally, there’s always the question of human abilities and “soft skills,” and to what extent those should be modified or replaced by AI in any professional field.  There’s no denying the limitations AI and algorithms face in making appropriate contextual considerations.  For example, how does AI account for a high school or for-profit college that historically participates in grade inflation?  How does AI account for additional challenges faced by a lower income or first-generation student? (Pangburn, 2019)  There are also no guarantees that applicants won’t figure out how to “game” data-based admissions systems down the road by strategically optimizing their own data, and if/when that happens, you can bet that the most educated, wealthiest, highest-resourced students and families will be the ones optimizing that data, therefore replicating a system of bias and inequity that already exists (Pangburn, 2019).

As an admissions official at a small, liberal arts institution, I am well aware of the challenges presented to recruitment and admissions processes in the present and future, and am heartened to consider the possibilities that AI and algorithms might bring to the table, especially regarding efforts towards equitable admissions practices and recruiting more diverse student bodies.  However, echoing the sentiments of Ruha Benjamin in The New Jim Code, I do not believe that technology is inherently neutral, and I do not believe that the use of AI or algorithms are comprehensive solutions for admissions bias.  Higher education officials must proceed carefully, thoughtfully, and with the appropriate amount of skepticism.

References:

Alvero, A.J., Arthurs, N., Antonio, A., Domingue, B., Gebre-Medhin, B., Gieble, S., & Stevens, M. (2020). AI and holistic review: Informing human reading in college admissions from the proceedings of the AAAI/ACM Conference on AI, Ethics, and Society, 200–206. Association for Computing Machinery. https://doi.org/10.1145/3375627.3375871

Benjamin, R. (2019).  Race after technology: Abolitionist tools for the New Jim Code. Polity.

Choi, Y.W. (2020, March 31). How to address racial bias in standardized testing. Next Gen Learning. https://www.nextgenlearning.org/articles/racial-bias-standardized-testing

Greenspan, R. (2019, May 15). Lori Loughlin and Felicity Huffman’s college admissions scandal remains ongoing. Here are the latest developments. Time. https://time.com/5549921/college-admissions-bribery-scandal/

Hassan, A. (2019, November 5). 5 takeaways from the Harvard admissions ruling. The New York Times. https://www.nytimes.com/2019/10/02/us/takeaways-harvard-ruling-admissions.html

Koenig, R. (2020, July 10). As colleges move away from the SAT, will algorithms step in? EdSurge. https://www.edsurge.com/news/2020-07-10-as-colleges-move-away-from-the-sat-will-admissions-algorithms-step-in

Mintz, S. (2020, July 13). Equity in college admissions. Inside Higher Ed. https://www.insidehighered.com/blogs/higher-ed-gamma/equity-college-admissions-0

Pangburn, D. (2019, May 17). Schools are using software to help pick who gets in. What could go wrong? Fast Company. https://www.fastcompany.com/90342596/schools-are-quietly-turning-to-ai-to-help-pick-who-gets-in-what-could-go-wrong

A Few Best Practices for Online Learning & Adoption in Higher Education

Though the digital age may not actually be changing a student’s capacity to learn, it’s certainly changing how students access content and participate in learning environments. Digital technology thoroughly transforms the way in which we create, manage, transfer, and apply knowledge (Duderstadt, Atkins, & Van Houweling, 2002). Unsurprisingly, it’s also changing how educators teach, particularly with technology-mediated instruction in higher education. The demand for online instruction is on the rise.  In the United States alone, the number of higher education students enrolled in online courses increased by 21% between fall 2008 and fall 2009, and the rate of increase has only grown in recent years, both nationally and globally (Bolliger & Inan, 2012).  Of course, the COVID-19 pandemic of 2020 has also necessitated a radical—though in some cases temporary—shift to online learning modalities at all educational levels across the globe.

Fortunately, there’s evidence to support that digital education incorporation can enhance pedagogy and improve overall student performance at the college level.  An extensive, multi-year case study conducted at the University of Central Florida showed that student success in blended programs (success being defined as achieving a C- grade or higher) actually exceeded the success rates of students in either fully online or fully face-to-face programs (Dziuban, C., Hartman, J., Moskal, P., Sorg, S., & Truman, B., 2004).

In the switch to online teaching and learning, a clear challenge is presented: teaching faculty are faced with a need to move their programs and classes into online/flexible learning formats, regardless of their discipline or their expertise/ability to do so.  It is not uncommon for teachers, no matter the level at which they teach, to be asked to implement something new in their classroom without sufficient support, professional development, or resources to make the implementation successful.  The need for appropriate training becomes that much more pressing when educators are asked to engage with an entirely different instruction medium from that which they are accustomed to.  In the case of blended or online learning, many faculty will need to develop completely new technological and/or pedagogical skills.  While a number of scholars have conducted investigations into the effectiveness of blended or online learning, very few have provided guidance for adoption at the institutional level (Porter, Graham, Spring, & Welch, 2014). 

Far from being a comprehensive guide, this post seeks to explore a few major themes and best practices for online learning in postsecondary education which may prove helpful for teaching professionals and higher education institutions heading into an otherwise unfamiliar world of digital education.

Create a Learning Community:

Digital education is made possible by computers and the internet.  In the age of the Internet, the computer is ultimately used most to provide connection, whether that be through social media, e-commerce, gaming, publications, or education (Weigel, 2002).  Technology-mediated education is making it possible for students to participate in programs, access content, and connect in ways they were previously unable to.  Rather than viewing the Internet as a necessary evil for distance learning that ultimately begets isolated student learning experiences, digital education should, first and foremost, be connective and communal.  This means a professor accustomed to lecture-based learning in a physical classroom may need to consider a new approach in order to make space for student voice in the learning process.  In an online context, this means there should be dynamic opportunities for students to engage in debate, reflection, collaboration, and peer review (Weigel, 2002).

Beyond Information Transfer:

Learning and schooling no longer have the same direct relationship they had for most of the 20th century; devices and digital libraries allow anyone to have access to information at any time (Wilen, 2009). Schools, teachers, and even books no longer hold the “keys to the kingdom” as sources of information.  Higher education, then, will not function effectively as a large-scale effort to teach students information through a standardized curriculum.  Rather, education must be a highly relevant venture that enables individual students to do something with the virtually endless information and resources they have access to (Wilen, 2009).

Relevance:

If university instructors are going to seriously account for the rich background experiences, varied motivations, and personal agency of their postsecondary students, they must also take into account the larger “lifewide” learning that takes place within the life of most college students (Peters & Romero, 2019). Student learning at any age is both formal and informal, and what takes place in a formal classroom environment is influenced by informal learning and daily living that takes place outside of it.  Likewise, if deep learning takes place, a student’s world and daily life should be altered by the creation of new schemas and the learning that has taken place in a formal classroom environment. 

In a multicase and multisite study conducted by Mitchell Peters and Marc Romero in 2019, 13 different fully-online graduate programs in Spain, the US, and the UK were examined in order to analyze learning processes across a continuum of contexts (i.e., to understand to what extent learning was used by the student outside of the formal classroom environment).  Certain common pedagogical strategies arose across programs in support of successful student learning and engagement including: developing core skills in information literacy and knowledge management, community-building through discussion and debate forums, making connections between academic study and professional practice, connecting micro-scale tasks (like weekly posts) with macro-scale tasks (like a final project), and applying professional interests and experiences into course assignments and interest-driven research (Peters & Romero, 2019).  In many regards, each of these pedagogical strategies is ultimately teaching students to “learn how to learn” so that the skills they cultivate in the classroom can be applied over and over again elsewhere.

Professional Development:

Still there remains the question of implementation.  In order for the mature adoption of digital education to take place, faculty need to be given time and training to help them develop new technological and pedagogical skills.  If an institution fails to provide sufficient opportunities for professional development, many faculty members will likely fail to fully embrace the shift to an online format, and will instead replicate their conventional teaching methods in a manner that isn’t compatible with effective online instruction (Porter, et al., 2014).  If higher education institutions are committed to delivering high quality instruction in all contexts, it will be important for administrators to retain qualified instructors who are motivated to teach online and who are satisfied with teaching online (Bolliger, Inan, & Wasilik, 2014).

 In a 2012-2013 survey of 11 higher education institutions reporting on their implementation of blended learning programs, Wendy Porter et al found that every university surveyed provided at least some measure of professional development to support faculty in the transition.  Each university had their own customized approach, but the fact that developmental support was prioritized in some regard remained consistent across all of the institutions in the survey.  Strategies used for professional development in digital learning included presentations, seminars, webinars, live workshops, orientations, boot camps, instructor certification programs for online teaching, course redesign classes, and self-paced training programs (Porter et al., 2014).

Digital Literacy:

Digital literacy among higher education faculty can’t be taken for granted.  A recent Action Research study aimed at exploring the digital capacity and capability of higher education practitioners found that, though the self-reported digital capability of an individual may be relatively high, it did not necessarily relate to the quality of their technical skills in relation to their jobs (Podorova et al., 2019).  Survey results from the study also showed that the majority of practitioners (41 higher education professors in Australia) were self-taught in the skills they did possess, receiving very little formal training or support from their employer, even with technology devices and tools directly pertaining to teaching and assessment (Podorova et al., 2019).  Though this data relates to a specific case study, it is not difficult to imagine that higher education faculty in institutions all over the world might report similar experiences.  If faculty aren’t given sufficient technological support and training, they will be less satisfied in their work and, ultimately, the student experience will suffer (Bolliger, et al., 2014).

Institutional Adoption:

In addition to providing sufficient technological or pedagogical resources, it is important for university administrators to communicate the purpose for online course adaptation.  In a later study conducted by Wendy Porter and Charles Graham in 2016, research indicated that higher education faculty more readily pursued effective adoption strategies when they were in alignment with the institution’s administrators and the stated purpose for doing so (Porter & Graham, 2016). If faculty members are, in essence, adult learners being asked to acquire new skills, it is essential to take their own motivations for learning into account.  Additionally, sharing data and course feedback internally from early-adopters to online instruction can go a long way in helping reticent faculty feel ready to approach online learning (Porter & Graham, 2016).  Institutional support is cited frequently in literature pertaining to faculty satisfaction in higher education. In the domain of online learning, institutional support looks like: providing adequate release time to prepare for online courses, fair compensation, and giving faculty sufficient tools, training, and reliable technical support (Bolliger et al., 2014).

One effective approach to professional development for online learning places professors in the seat of the student.  At Hawaii’s Kapi’olani Community College on the island of Oahu, Instructional Designer Helen Torigoe was charged with training faculty in the process of converting courses for online delivery.   In response, Torigoe created the Teaching Online Prep Program (TOPP) (Schauffhauser, 2019). In TOPP, faculty participate in an online course model as a student, using their own first-hand experience to inform their course creation.  As they participate in the course, faculty are able to use the technology that they will be in charge of as an instructor (programs like Zoom, Padlet, Flipgrid, Adobe Spark, Loom, and Screencast-O-Matic), gaining comfort and ease with the tools and increasing their overall digital literacy.  Faculty also get a comprehensive sense for the student experience while concurrently creating an actual course template and receiving guidance and support from the TOPP course coordinator.  Such training is mandatory for anybody teaching online for the first time at Kapi’olani Community College. A “Recharge” workshop has also been created to help faculty engage in continued learning for best practice in digital education, ensuring that faculty do not become static in their teaching methods and are consistently exposed to new tools and strategies for digital education (Schauffhauser, 2019).  Institutions that participate in online education need to provide adequate training in both pedagogical issues and technology-related skills for their faculty, not only when developing and teaching online courses for the first time, but as an ongoing priority in faculty professional development (Bolliger et al., 2014).

Summary:     

The number of graduate courses and programs that must be offered in an online format is increasing in many higher education environments.  Effective online educators will acknowledge the unique needs of their postsecondary learners: that their students need to have their background experiences and context utilized in the learning process, that their learning needs to be relevant to their life and work, and that their learning needs to be providing them with actionable skills and learning strategies that ultimately change how they interact with their world.  Effective online learning will also provide ample space for student connection and active participation.  This means there should be dynamic opportunities for students to engage in debate, reflection, collaboration, and peer review (Weigel, 2002).  Additionally, online learning ought to be a highly relevant venture that enables individual students to do something with the virtually endless information and resources they have access to (Wilen, 2009).  Yet in order for the mature adoption of digital education to take place, faculty need to be given time and training to help them develop new technological and pedagogical skills.  This training needs to happen with initial adoption and as an ongoing venture.  One example of highly effective faculty professional development can be found in Instructional Designer Helen Torigoe’s Teaching Online Prep Program (TOPP) (Schaffhauser, 2019).  In this program the instructors become the students as they familiarize themselves with a new learning system, create a customized course template, and get feedback and support from knowledgeable online educators.  In short, well-equipped, well-trained, and well-supported graduate faculty are fertile ground for effective online education.

References

Bolliger, D. U., Inan, F. A., & Wasilik, O. (2014). Development and validation of the online instructor satisfaction measure (OISM). Educational Technology Society, 17(2), 183–195.

Duderstadt, J., Atkins, D., Van Houweling, D. (2002). Higher education in the digital age: Technology issues and strategies for American colleges and universities. Praeger Publishers.

Dziuban, C., Hartman, J., Moskal, P., Sorg, S., & Truman, B. (2004). Three ALN modalities: An institutional perspective. In J. R. Bourne, & J. C. Moore (Eds.), Elements of quality online education: Into the mainstream (127–148). Sloan Consortium.

Peters, M. & Romero, M. (2019) Lifelong learning ecologies in online higher education: Students’ engagement in the continuum between formal and informal learning. British Journal of Educational Technology, 50(4), 1729.

Podorova, A., Irvine, S., Kilmister, M., Hewison, R., Janssen, A., Speziali, A., …McAlinden, M. (2019). An important, but neglected aspect of learning assistance in higher education: Exploring the digital learning capacity of academic language and learning practitioners. Journal of University Teaching & Learning Practice, 16(4), 1-21.

Porter, W., & Graham, C. (2016). Institutional drivers and barriers to faculty adoption of blended learning in higher education. British Journal of Educational Technology, 47(4), 748-762.

Porter, W., Graham, C., Spring, K., & Welch, K. (2014). Blended learning in higher education: Institutional adoption and implementation. Computers & Education, 75, 185-195.

Schaffhauser, D.  (2019). Improving online teaching through training and support. Campus Technology. https://campustechnology.com/articles/2019/10/30/improving-online-teaching-through-training-and-support.aspx

Weigel, V.B. (2002) Deep learning for a digital age. Jossey-Bass.

Wilen, T. (2009). .Edu: Technology and learning environments in higher education. Peter Lang Publishing.

css.php