Though online teaching/learning are hardly new concepts in education, the pandemic has necessitated a massive shift to online learning such that educators worldwide–at all levels–have had to engage with online learning in new, immersive ways. Online learning can take many forms (synchronous, asynchronous, hybrid, hyflex, etc.), but regardless of the form, educators with access to an LMS have been forced to lean into these platforms and leverage the tools within in significant ways, continually navigating (perhaps for the first time) how to best support students in achieving their learning goals using technology.
Without consistent opportunities for face-to-face communication and informal indicators of student engagement that are typically available in a classroom (e.g. body language, participation in live discussions, question asking) a common challenge faced by educators in online learning environments–especially asynchronous ones–is how to maintain and account for student engagement and persistence in the course. Studies using Educational Data Mining (EDM) have already demonstrated that student behavior in an online course has a direct correlation to their successful completion of the course (Cerezo et al., 2016). Time and again, these studies have supported the assertion that students who are more frequently engaged with the content and discussions in an online course are more likely to achieve their learning goals and successfully complete the course (Morris et al., 2005). This relationship is, however, tricky to measure, because time spent online is not necessarily representative of the quality of the online engagement. Furthermore, different students develop different patterns of interaction within an LMS which can still lead to a successful outcome (Cerezo et al., 2016). Consequently, even as instructors look for insights into student engagement from their LMS, they must avoid putting too much emphasis on the available data, or even a ‘one style fits all’ approach to interpreting it. Instead, LMS analytics should be considered as one indicator of student performance that contributes to the bigger picture of student learning and achievement. Taken in context, the data that can be quickly gleaned from an LMS can be immensely helpful in identifying struggling or ‘at-risk’ students and/or those who could benefit from differentiated instruction, as well as possible areas of weakness within the course design that need addressing.
Enter LMS analytics tools and the information available within. For the purposes of this post, I’ll specifically be looking at the suite of analytics tools provided by the Canvas LMS, including Course Analytics, Course Statistics, and ‘New Analytics.’

- Course Analytics are intended to help instructors evaluate individual components of a course as well as student performance in the course. Course analytics are meant to help identify at-risk students (i.e. those who aren’t interacting with the course material), and determine how the system and individual course components are being used. The four main components of course analytics are:
- Student activity, including logins, page views, and resource usage
- Submissions, i.e. assignments and discussion board posts
- Grades, for individual assignments as well as cumulative
- Student analytics, which is a consolidated page view of the student’s participation, assignments, and overall grade (Canvas Community(a), 2020). With permission, students may also view their own analytics page containing this information.
- Course Statistics are essentially a subset of the larger course analytics information pool. Course statistics offer specific percentages/quantitative data for assignments, discussions, and quizzes. Statistics are best used to offer quick, at-a-glance feedback regarding which course components are engaging students and what might be improved in the future (Canvas Community(b), 2020).
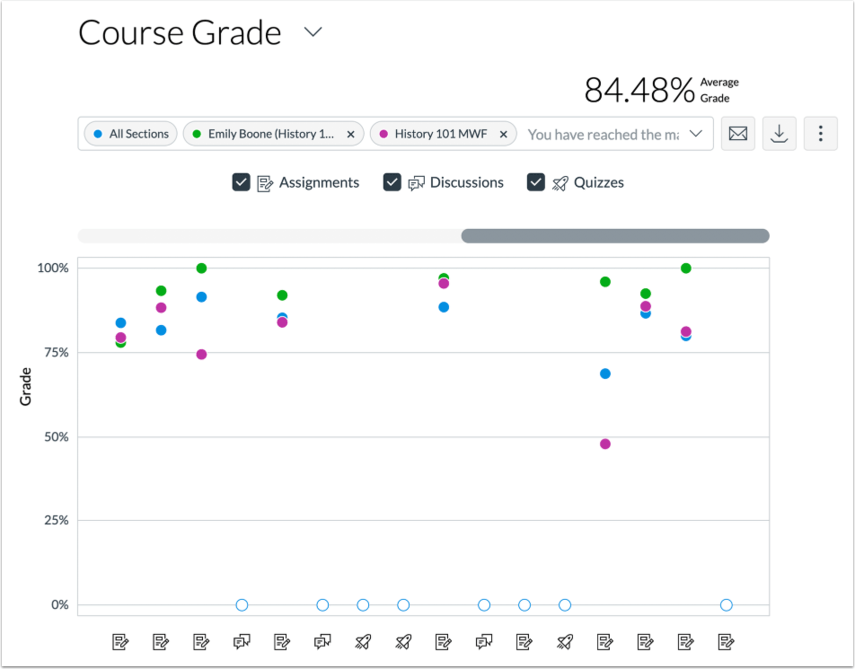
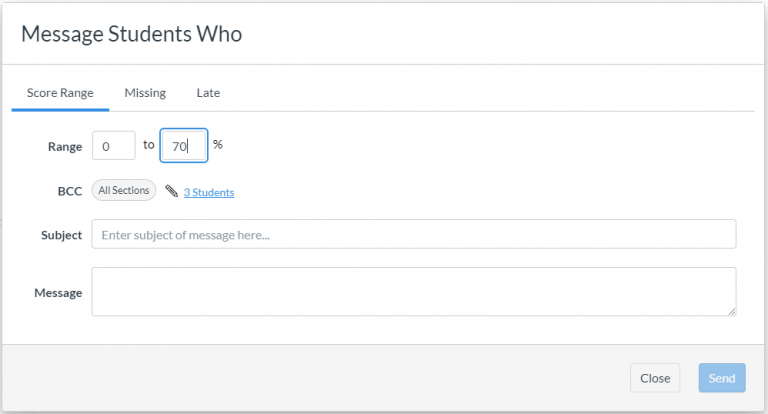
- New Analytics is essentially meant to be “Course analytics 2.0” and is currently in its initial rollout stage. Though the overall goal of the analytics tool(s) remains the same, New Analytics offers different kinds of data displays and the opportunity to easily compare individual student statistics with the class aggregate. The data informing these analytics is refreshed every 24 hours, and instructors may also look at individual student and whole class trends on a week-to-week basis. In short, it’s my impression that ‘New Analytics’ will do a more effective job of placing student engagement data in context. Another feature of New Analytics is that instructors may send a message directly to an individual student or the whole class based on a specific course grade or participation criteria (Canvas Community(c), 2020).

Of course, analytics and statistics are only one tool in the toolbelt when it comes to gauging student achievement, and viewing course statistics need not be the exclusive purview of the instructor. As mentioned above, with instructor permission, students may view their own course statistics and analytics in order to track their own engagement. Beyond viewing grades and assignment submissions, this type of feature can be particularly helpful for student reflection on course participation, or perhaps as an integrated part of an improvement plan for a student who is struggling.
Timing should also be a consideration when using an LMS tool like Canvas’ Course Analytics. When it comes to student engagement and indicators of successful course completion, information gathered in the first weeks of the course can prove invaluable. Rather than being used solely for instructor reflection or summative ‘takeaway’ information about the effectiveness of the course design, course analytics may be used as early predictors of student success, and the information gleaned may be used to initiate interventions from instructors or academic support staff (Wagner, 2020). Thus, instructors who use Canvas will likely find that their Canvas Analytics tools might actually prove most helpful within the first week or two of the course (University of Denver Office of Teaching & Learning, 2019). For example, if a student in an online course is having internet access issues, the instructor can likely see this reflected early-on in the student’s LMS analytics data. The instructor would have reason to reach out and make sure the student has what they need in order to engage with the course content. If unstable internet access is the issue, the instructor may then flex due dates, provide extra downloadable materials, or continually modify assignments as needed throughout the quarter in order to better support the student.
Finally, as mentioned above, in addition to student performance, LMS analytics tools may be used by the instructor to think about the efficacy of their course design. Canvas’ course analytics tools help instructors see which resources are being viewed/downloaded, which discussion boards are most active (or inactive), what components of the course are most frequented, etc. Once an online course has been constructed, it can be tempting for instructors to “plug and play” and assume that the course will retain its same effectiveness in every semester it’s used moving forward. Course analytics can help instructors identify redundancies and course elements that are no longer needed/relevant due to lack of student interest. They can also help instructors think critically about what seems to be working well in their course (i.e. what are students using, where are they spending the most time in the course) why that might be, and how to leverage that for adding other course components or tweaks for the future.
In summary, the information available via an LMS analytics tool should always be considered in concert with all other factors impacting student behavior in online learning, including varying patterns or ‘styles’ in students’ online behaviors and external factors like personal or societal crises that may have impacted the move to online learning in the first place. Student engagement (as measured by LMS analytics tools) can be helpful tools used for identifying struggling students, providing data for student self-reflection, and providing insight into the effectiveness of the instructors’ course design. To the extent that analytics tools aren’t considered the “end all be all” when it comes to measuring student success, tools like Canvas Analytics are a worthwhile consideration for instructors teaching online who are invested in student success as well as their own professional development.
References:
Canvas Community(a). (2020). What are Analytics? Canvas. https://community.canvaslms.com/t5/Canvas-Basics-Guide/What-are-Analytics/ta-p/88
Canvas Community(b). (2020). What is New Analytics? Canvas. https://community.canvaslms.com/t5/Canvas-Basics-Guide/What-is-New-Analytics/ta-p/73
Canvas Community(c). (2020). How do I view Course Statistics? Canvas. https://community.canvaslms.com/t5/Instructor-Guide/How-do-I-view-course-statistics/ta-p/1120
Cerezo, R., Sanchez-Santillan, M., Paule-Ruiz, M., & Nunez, J. (2016). Students’ LMS interaction patterns and their relationship with achievement: A case study in higher education. Computers & Education 96, 42-54. https://www.sciencedirect.com/science/article/pii/S0360131516300264
Morris, L.V., Finnegan, C., & Wu, S. (2005). Tracking student behavior, persistence, and achievement in online courses. The Internet and Higher Education 8, 221-231. https://www.sciencedirect.com/science/article/pii/S1096751605000412
Wagner, A. (2020, June 6). LMS data and the relationship between student engagement and student success outcomes. Airweb.org. https://www.airweb.org/article/2020/06/17/lms-data-and-the-relationship-between-student-engagement-and-student-success-outcomes
